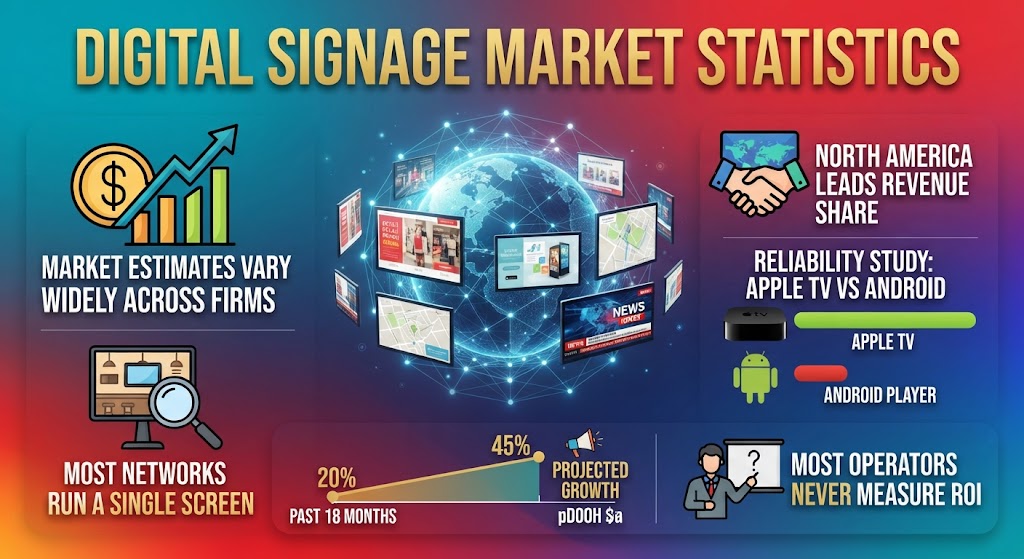
Four research firms price the digital signage market in 2026 between USD 21.07 billion and USD 34.42 billion, and none of them counts the same basket. Fleet telemetry tells a second story the sizing reports skip: most networks run a single screen, most content is weeks old, and three quarters of operators never measure a return. Every figure below carries its source and period.
Digital Signage Market: Five Numbers That Frame 2026
How Big Is the Digital Signage Market in 2026?
Each firm measures vendor revenue under its own scope definition, so the estimates are not interchangeable.
Fortune Business Insights sits at the top with USD 34.42 billion. MarketsandMarkets sits at the bottom with USD 21.07 billion and the slowest growth rate of the five.
| Research firm | 2026 value | Long-range forecast | CAGR |
|---|---|---|---|
| Fortune Business Insights | USD 34.42 B | USD 69.90 B (2034) | 9.26% |
| Market Research Future | USD 31.85 B | USD 62.18 B (2035) | 7.65% |
| Precedence Research | USD 31.42 B | USD 57.72 B (2035) | 7.06% |
| Global Market Insights | USD 25.60 B | USD 49.40 B (2034) | 8.6% |
| MarketsandMarkets | USD 21.07 B | USD 30.91 B (2032) | 6.6% |
Source: Fortune Business Insights, Market Research Future, Precedence Research, Global Market Insights and MarketsandMarkets digital signage reports, 2026 editions. Each CAGR covers that firm’s own stated forecast window.
Precedence Research also publishes a country cut. The United States moves from USD 7.61 billion in 2025 to USD 15.36 billion by 2035, a 7.28% CAGR on its own numbers, slightly above its 7.06% global rate.
How Many Digital Signage Screens Are Deployed Worldwide?
Berg Insight counted 91.5 million installed digital signage displays in 2023 and projects 149.4 million by 2028, growth of roughly 10.3% a year. Kitcast, citing that curve, estimates 100 to 110 million connected displays in active use today.
Screen counts per network look nothing like the enterprise rollouts that generate the revenue. Kitcast measured 10,520 paid workspaces in an SMB-weighted sample.
| Network size metric | Screens per workspace |
|---|---|
| Median network | 1 |
| Mean network | 4 |
| 90th percentile | 8 |
| 99th percentile | 37 |
| Largest in sample | 235 |
Source: Kitcast, State of Digital Signage 2026 fleet telemetry, published June 2026 (n=10,520 workspaces; SMB-focused sample, measured per workspace not per company).
Kitcast notes that market reports commonly assume a 23-screen average deployment. Its own sample lands at four. The company flags that its enterprise cohort is measured separately and will read differently.
Digital Signage Market Share by Region and Segment
Global Market Insights splits 2025 revenue across five regions that total 100%. North America leads at 35.5%, with Asia Pacific and Europe separated by a tenth of a point.
| Region | 2025 revenue share |
|---|---|
| North America | 35.5% |
| Asia Pacific | 27.7% |
| Europe | 27.6% |
| Latin America | 5.7% |
| Middle East & Africa | 3.5% |
Source: Global Market Insights, Digital Signage Market Size & Share 2026–2034, regional shares for 2025.
Precedence Research puts North America above 37% for the same year, so 35% to 37% is close to settled. The two firms disagree on almost everything else about the market’s size but not on who leads it.
Within its own segmentation, Precedence reports hardware at 56.60% of 2025 component revenue, LED at 47% of technology revenue, in-store at 73% of location revenue, and retail at 21% of application revenue. No single vertical controls even a quarter of spend, which is one reason vertical-specific pricing has never consolidated the way it has in paid search and display buying.
Which Digital Signage Segments Are Growing Fastest?
Global Market Insights attaches forecast CAGRs to six segments across different axes. Every one of them outpaces its own 8.6% full-market rate.
| Segment | Forecast CAGR, 2026–2034 |
|---|---|
| Interactive content | 11.7% |
| OLED displays | 11.5% |
| Software | 10.4% |
| Medium businesses | 10.0% |
| Outdoor locations | 9.9% |
| 32 to 52 inch displays | 9.3% |
Source: Global Market Insights, Digital Signage Market Size & Share 2026–2034, segment growth forecasts.
How Reliable Is Digital Signage Hardware?
Kitcast ran a 12-month reliability study across 1,000 Apple TV units and 250 low-cost Android media players priced between USD 20 and USD 150. The samples are unequal and the telemetry comes from one platform, which the report discloses.
| Reliability metric | Apple TV (n=1,000) | Android (n=250) |
|---|---|---|
| Median 12-month uptime | 99.31% | 96.63% |
| Average uptime | 98.4% | 94.4% |
| Screens at 99%+ uptime | 70.3% | 12.0% |
| Screens below 95% uptime | 6.8% | 30.4% |
| Offline events per screen, yearly | 5.3 | 15.2 |
| Annual device replacement | ~2% | ~18% |
Source: Kitcast, State of Digital Signage 2026 hardware reliability study, 12-month window ending 2026.
Kitcast reports the Android group was replaced roughly nine times more often over the study window. The media player invoice is the smallest line in that comparison.
Programmatic DOOH Buying in 2026
VIOOH surveyed 1,050 advertisers and agencies with MTM across the US, UK, France and the Middle East, adding Qatar, Saudi Arabia and the UAE for the first time. Among recent buyers, programmatic DOOH featured in 34% of campaigns over the past 18 months and is projected to reach 48% over the next 18.
Respondents expect an average 44% increase in pDOOH spend over the next 18 months, and 99% of recent buyers plan to hold or raise investment. AI already touches 90% of campaigns at some stage.
Three core-market indicators moved in different directions between the 2024 and 2026 editions.
| Core-market indicator | 2024 | 2026 |
|---|---|---|
| Dedicated pDOOH teams in place | 32% | 53% |
| Dynamic creative optimisation in active use | 13% | 8% |
| Sustainability ranked in top three factors | 32% | 15% |
Source: VIOOH State of the Nation 2026, published 19 March 2026; core markets are the UK, France and the US.
Dynamic creative optimisation fell in live use even though 66% of global respondents say they will expand it. Intent and execution have separated, the same pattern that shows up across platform advertising adoption curves.
Digital Signage and In-Store Retail Media
EMARKETER forecasts US retail media ad spending at USD 72.97 billion in 2026, up 20.3% year over year. Excluding Amazon, which captured over 75% of retail media spend in 2025, in-store took just 3.3% of what remained.
EMARKETER has pushed back its projected milestones for the channel because adoption ran slower than expected. More than 80% of US retail sales still happen in physical stores, which is why chains at the scale covered in Walmart’s 2026 revenue and store data keep adding screen inventory even as online retail keeps taking share.
Perion bought PRN for up to USD 12 million in cash on 26 August 2026, expecting roughly USD 3 million of adjusted EBITDA in 2027 before synergies. The footprint it acquired:
| PRN network | Locations |
|---|---|
| Big-box retailer stores | 4,500+ |
| Healthcare retailer locations | 2,200+ |
| Warehouse club 4K network | 750+ |
Source: Perion Network, acquisition announcement, 26 August 2026.
Do Digital Signage Operators Measure ROI?
Kitcast surveyed 515 operators. Measurement is close to absent, and the response options overlap, so the figures below are not exclusive shares.
Only 2.9% tie screens to sales lift, yet 55.6% rate their return as modestly positive. Content data suggests why the confidence is untested: median on-screen content is 16.8 days old, 27.7% of scheduled creative predates last year, and education averages 49.3 days against hospitality’s 3.9.
AI use sits at 8.3% today with 46.2% planning adoption within 12 months. Among non-users, 72.8% cite no perceived need and only 1.6% cite cost, a different blocker profile from the one visible in enterprise AI vendor spending.
What Do Operators Pay Per Screen?
Software spend clusters tightly. These six bands are mutually exclusive and total 100%.
Source: Kitcast, State of Digital Signage 2026 operator survey, n=515, self-reported, fielded 2026.
Digital Signage Market Consolidation in 2026
Two of the category’s best-known assets left Stratacache’s portfolio within four months of each other.
| Transaction | Date announced | Value |
|---|---|---|
| Vertiseit acquires Scala | 20 May 2026 | SEK 265 M (~USD 28 M) |
| Perion acquires PRN | 26 August 2026 | Up to USD 12 M |
Source: Vertiseit press release, 20 May 2026; Perion Network press release, 26 August 2026.
Scala, founded in 1987 and serving over 1,000 brands through more than 100 partners, brings Vertiseit roughly SEK 200 million in full-year revenue including SEK 85 million of ARR. Vertiseit announced completion of the deal in early June 2026. Legacy on-premise CMS estates are clearing well below the recurring-revenue multiples that sizing reports imply, a divergence also visible in software licensing revenue mixes and in ad-supported streaming economics.
FAQs
How big is the digital signage market in 2026?
Estimates range from USD 21.07 billion (MarketsandMarkets) to USD 34.42 billion (Fortune Business Insights). Precedence Research puts 2026 at USD 31.42 billion and Market Research Future at USD 31.85 billion. Each firm uses its own scope definition.
How many digital signage screens are installed worldwide?
Berg Insight counted 91.5 million installed displays in 2023 and projects 149.4 million by 2028, about 10.3% growth a year. Kitcast estimates 100 to 110 million connected displays in active use.
Which region leads the digital signage market?
North America, at 35.5% of 2025 global revenue per Global Market Insights. Asia Pacific follows at 27.7% and Europe at 27.6%. Precedence Research puts North America above 37% for the same year.
Which digital signage media player is most reliable?
Reddit threads trade anecdotes; the measured answer comes from Kitcast’s 12-month study of 1,000 Apple TV and 250 low-cost Android devices: 99.31% median uptime on Apple TV against 96.63%, with roughly 2% versus 18% annual replacement.
Do digital signage operators measure ROI?
Rarely. In Kitcast’s 515-operator survey, 76.5% measure no ROI at all and only 6.2% use a concrete method. Even so, 55.6% rate their return as modestly positive.
Sources
https://www.precedenceresearch.com/digital-signage-market
https://www.gminsights.com/industry-analysis/digital-signage-market-report
https://kitcast.tv/reports/state-of-digital-signage-2026
https://blog.viooh.com/state-of-the-nation-viooh-2026-global-report