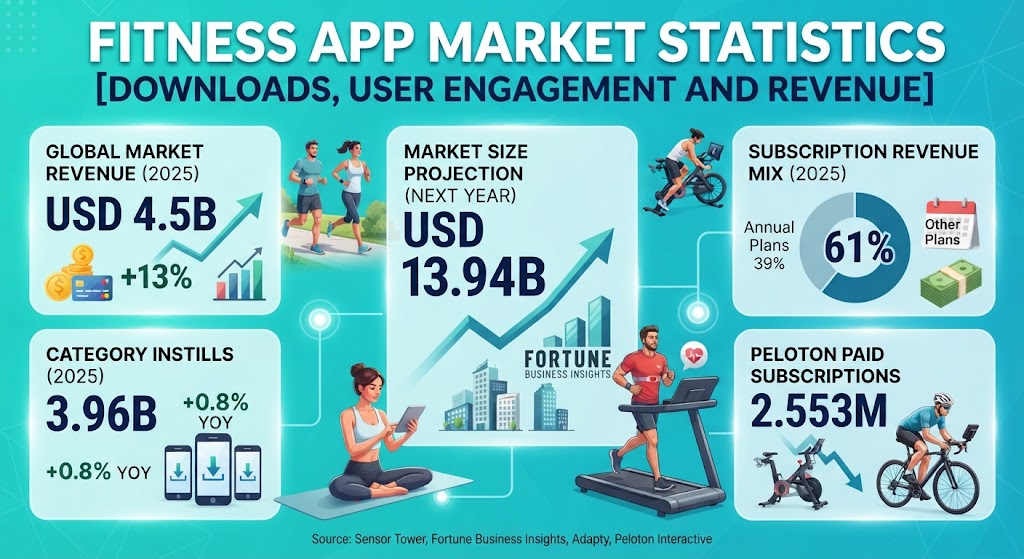
Health and fitness apps collected USD 4.5 billion in in-app purchases worldwide during 2025, up 13%, while installs in the same category rose 0.8%, according to Sensor Tower. Spending and downloads have split apart. This post sets out the verified numbers on market size, download rankings, regional and platform shares, subscription conversion and the companies filing results.
Fitness App Market
How Big Is The Fitness App Market In 2026?
Fortune Business Insights values the fitness app market at USD 13.94 billion for 2026 and USD 38.71 billion by 2034, a 13.62% compound annual rate.
Polaris Market Research puts 2025 at USD 12.91 billion and forecasts USD 40.26 billion by 2034 at 13.5%. The two firms sit within 0.12 points of each other on growth.
| Research firm | Base year value | Forecast | CAGR |
|---|---|---|---|
| Fortune Business Insights | USD 12.27B (2025) | USD 38.71B by 2034 | 13.62% |
| Polaris Market Research | USD 12.91B (2025) | USD 40.26B by 2034 | 13.5% |
Source: Fortune Business Insights, Fitness App Market report updated August 2026; Polaris Market Research, Fitness App Market Forecast 2026-2034. Figures measure vendor revenue under each firm’s own scope definition.
Both are projections published by the named firms, not observed revenue. Teams that track how estimates drift between editions usually commission corporate forecast reports rather than relying on a single vendor.
Fitness App Market Downloads Versus In-App Spending
Sensor Tower counted 3.96 billion health and fitness installs in 2025. Download growth of 0.8% came in below both 2023 and 2024.
In-app purchase revenue over the same year reached a record USD 4.5 billion. Running and cycling apps and AI-driven nutrition tracking ranked among the top subgenres by revenue growth.
| Metric | 2025 | Change vs 2024 |
|---|---|---|
| Category installs worldwide | 3.96 billion | +0.8% |
| In-app purchase revenue | USD 4.5 billion | +13% |
Source: Sensor Tower, State of Mobile 2026, calendar year 2025. Installs and in-app purchase revenue cover the App Store and Google Play.
Publishers moved their bidding to match. The share of health and fitness apps bidding on AI-themed keywords hit 28% in the most recent quarter Sensor Tower reported, up from 19% in Q4 2024, at an average of eight AI keywords per app.
Which Apps Led Fitness App Market Downloads In 2025?
Flo Period & Ovulation Tracker topped AppTweak’s ranking with 55.6M downloads. Two of the top four are companion apps bundled with low-cost wearables.
| Rank | App | Downloads | Year on year |
|---|---|---|---|
| 1 | Flo Period & Ovulation Tracker | 55.6M | +5.8% |
| 2 | Mi Fitness (Xiaomi Wear) | 36.8M | +22.9% |
| 3 | Home Workout – No Equipment | 27.0M | -16.7% |
| 4 | Da Fit | 26.2M | -16.5% |
| 5 | Dash Analog Watch face | 25.5M | +40.0% |
| 6 | MyFitnessPal: Calorie Counter | 23.3M | +22.4% |
Source: AppTweak Market Intelligence, January-November 2025, worldwide, App Store and Google Play combined, top 500 Health & Fitness apps. Downloads are estimated installs, not users.
Segment Volumes
Wearable companion apps drew 320M downloads, ahead of fitness and workouts at 311M. AppTweak recorded 1.83 billion Health & Fitness downloads in total over January to November 2025, growth of 5.1%.
The two counts differ because AppTweak and Sensor Tower define the category differently, so they are not comparable figures.
Fitness App Market Share By Region, Platform And Device
North America holds 38% of fitness app revenue in 2026, with the United States contributing 81% of that region’s app downloads. Asia-Pacific follows at 29% and Europe at 26%.
Exercise and weight loss applications account for 48% of the market by type, ahead of diet and nutrition at 29%.
| Application type | Share of fitness app market, 2026 |
|---|---|
| Exercise and weight loss | 48% |
| Diet and nutrition | 29% |
| Activity tracking | 23% |
Source: Fortune Business Insights, Fitness App Market report updated August 2026, shares for 2026.
Android holds 67% market share against 33% for iOS on the same measure. By device, smartphones take 58%, wearables 28% and tablets 14%.
Fitness App Market Subscription Economics
Health & Fitness records the highest median 12-month install lifetime value of any App Store category at USD 1.21, against USD 0.59 for Entertainment.
Plan mix runs against the wider market. Annual plans took 61% of Health & Fitness subscription revenue in 2025, up from 51% in 2023, while weekly plans generate 56% of subscription revenue across all categories.
Conversion is front-loaded. In Health & Fitness, 86.1% of trials start on day zero and 2.6% start across days four to fourteen.
| Funnel stage | Rate |
|---|---|
| Install to trial start | 9.5% |
| Trial to paid | 42.2% |
| First renewal | 67.7% |
Source: Adapty, State of In-App Subscriptions 2026, Health & Fitness weekly plans with a trial, 2025 data from 16,000+ apps processing over USD 3 billion in subscription revenue.
Adapty’s renewal curve below is the global average across all categories in that report, not a Health & Fitness cut. Because annual billing dominates this category, each step represents a full year for most of its subscribers.
Concentration is real but milder here than elsewhere. The top 10% of Health & Fitness apps capture 92.6% of category subscription revenue, against 97.9% in Lifestyle.
What Peloton Reports To The Fitness App Market
Peloton ended the quarter to 30 June 2026 with 2.553 million paid connected fitness subscriptions, down 247,000 or 8.8% year on year.
Subscription revenue still rose 7% to USD 436.6 million over the same quarter. Average net monthly connected fitness churn was 2.2%, against 1.2% in the March quarter.
| User metric (millions) | Q4 FY25 | Q3 FY26 | Q4 FY26 |
|---|---|---|---|
| Paid connected fitness subscriptions | 2.800 | 2.662 | 2.553 |
| Paid app subscriptions | 0.552 | 0.522 | 0.503 |
| Members | 6.0 | 5.8 | 5.5 |
Source: Peloton Interactive, Q4 and FY2026 results, quarter ended 30 June 2026, published 6 August 2026.
Fiscal 2026 was Peloton’s first full year of positive net income, at USD 63.2 million on revenue of USD 2.446 billion. Guidance for the September 2026 quarter puts connected fitness subscriptions between 2.455 million and 2.475 million.
Wearable Ownership Behind Fitness App Market Demand
Rock Health’s 2025 survey of 8,000 census-matched US adults found 57% own at least one wearable or connected device. Wearable ownership alone sits at 46%, up from 13% in 2015.
| Ownership, share of 8,000 US adults surveyed | December 2025 |
|---|---|
| At least one wearable or connected device | 57% |
| A wearable specifically | 46% |
| A wearable, 2015 comparison | 13% |
Source: Rock Health, 2025 Consumer Adoption of Digital Health Survey, fielded 1-23 December 2025. Categories overlap and are not exclusive shares.
Among wearable owners, 83% wear the device five or more days a week and 59% have discussed the resulting data with a healthcare provider. Physical activity is the most tracked signal.
Rock Health notes that first-time wearable buyers are getting harder to find, which puts the pressure back on engagement. Strava reported over 180 million users across more than 185 countries in December 2025, with 72% recording workouts through the Strava app itself and 14 billion kudos given during the year.
Clinical use of that data is the next question, and it runs into the privacy and integration problems covered in work on synthetic health datasets and on AI in patient care.
Sensor readouts are also widening beyond movement, including pollution-exposure wearables aimed at runners and outdoor workers. Longer-dated scenarios sit in Quantumrun’s healthcare predictions for 2028 and its country-level futures.
A wider breakdown of pricing, retention and paywall benchmarks sits in this fitness app market statistics roundup.
FAQs
How big is the fitness app market in 2026?
Fortune Business Insights projects USD 13.94 billion for 2026, rising to USD 38.71 billion by 2034 at a 13.62% compound annual rate. Polaris Market Research forecasts USD 40.26 billion by 2034 at 13.5%.
How many fitness app downloads were there in 2025?
Sensor Tower recorded 3.96 billion health and fitness installs worldwide in 2025, up 0.8% year on year. In-app purchase revenue for the same category rose 13% to USD 4.5 billion.
Reddit threads keep debating annual versus monthly fitness app plans. What does the data show?
Annual plans took 61% of Health & Fitness subscription revenue in 2025, up from 51% in 2023, according to Adapty. It is the only App Store category where annual plans are still gaining revenue share.
Is Peloton still losing subscribers, as Reddit users often claim?
Yes. Peloton ended the quarter to 30 June 2026 with 2.553 million paid connected fitness subscriptions, down 247,000 or 8.8% year on year. Subscription revenue over the same quarter rose 7% to USD 436.6 million.
Which fitness app had the most downloads in 2025?
Flo Period & Ovulation Tracker led AppTweak’s Health & Fitness ranking with 55.6M downloads between January and November 2025, ahead of Mi Fitness at 36.8M and Home Workout at 27.0M.
Sources
https://www.fortunebusinessinsights.com/fitness-app-market-116380
https://sensortower.com/blog/health-and-fitness-apps-ai
https://www.apptweak.com/en/reports/most-downloaded-health-fitness-apps
https://investor.onepeloton.com/news-releases/news-release-details/peloton-announces-q4-fy2026-financial-results