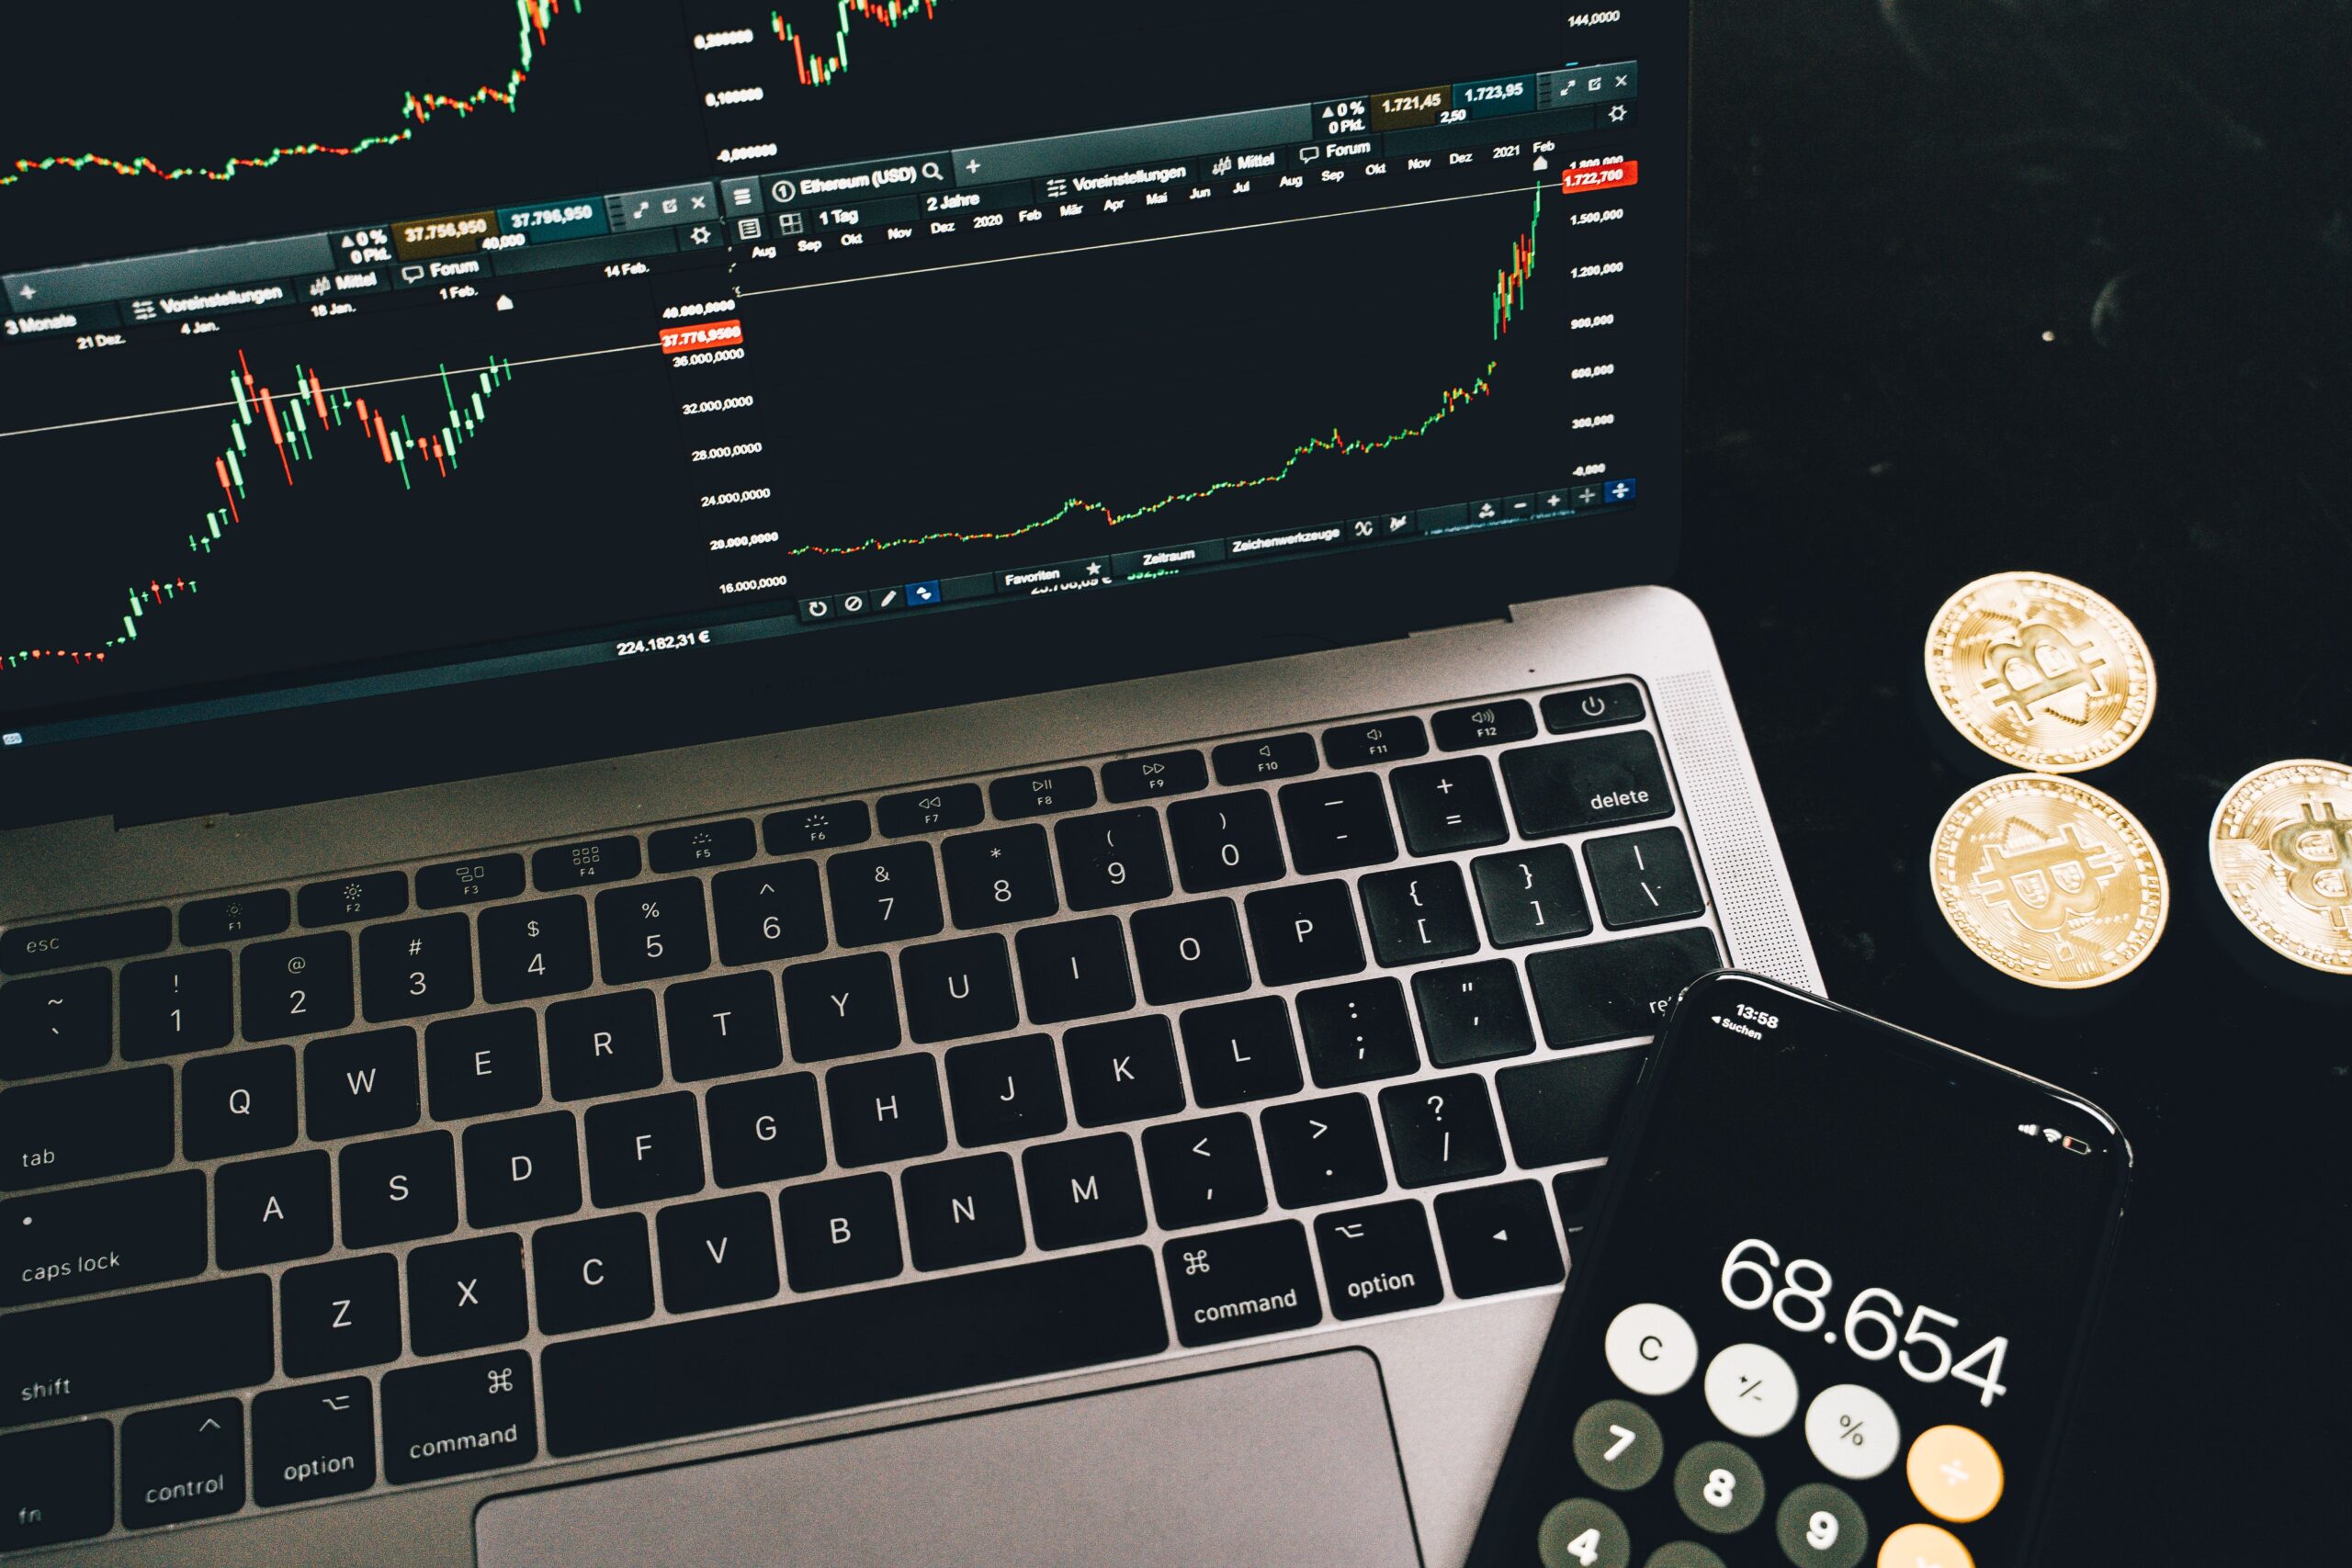
Crypto cycles now draw attention from investors and policy staff because the sector no longer moves at the edge of finance. Bitcoin exchange-traded products brought a wider audience into the market in 2024. AP reported that Bitcoin briefly passed $68,800 in March 2024 after spot bitcoin ETF approvals helped push demand through its market report.
The same report noted that the asset had climbed more than 175% in a year. That rise came less than two years after the FTX collapse damaged confidence across crypto. Cycles in this market can compress memory and reward patience in the same month.
For businesses and researchers, the pattern deserves more than a price chart. A cycle can begin with liquidity and attention. It can then gather leverage. At the top, a strong story starts to look like proof.
When selling arrives, weak positions fall first. IMF researchers identified a single “crypto factor” that explains 80% of variation in crypto prices through their paper on the crypto cycle and US monetary policy. That finding helps explain why many digital assets often rise and fall together.
The first step is purpose
Potentially investing in crypto starts with a basic question. What role should the asset play? A person may want long-term exposure to a network.
A trader may want a shorter move. A business may study crypto because client demand keeps appearing in payments or treasury conversations. Each goal needs a different time frame.
Binance lists the Sol price at $75.71 today on its Solana price page. The same page shows a market cap of about $44.1 billion and 24-hour trading volume of about $2.1 billion.
That current value gives a live reference before anyone studies Solana as part of a cycle. Price can show the present mood. It cannot explain the whole asset.
A newcomer should look at network activity and liquidity before deciding whether the move reflects durable demand or a short burst of buying.
Halving is only one clock
Bitcoin’s halving often shapes cycle talk. AP explains shapes cycle talk. AP explains that halving cuts the reward for mining bitcoin and slows new supply through its April 2024 explainer. The event happens about every four years. Traders often watch it because lower new supply can affect pricing when demand rises.
Still, halving does not control the full market. Interest rates and ETF flows can change the picture. Regulation can do the same. A cycle built only around one date can miss the forces that arrive from outside crypto. The better view treats halving as one input. It then checks liquidity and positioning.
Attention can drive prices
Retail behavior gives cycles much of their speed. NBER researchers studied 200,000 retail traders and found that the same people acted differently in crypto than they did in stocks and gold through Are Cryptos Different? Evidence from Retail Trading.
They tended to follow momentum in crypto. In simpler terms, a rising price made many buyers expect more adoption and further gains.
That habit can push a cycle upward. It can also make a downturn harsher. When buyers enter because price already rose, they often have less patience when the chart turns.
The market then loses the same attention that helped bring in capital. Businesses watching crypto should track sentiment with care because demand can look stronger than it really is during a fast rise.
Adoption changes the rhythm
Global adoption can deepen a market. It can also spread cycles across regions. Chainalysis ranked India first and the United States second in its 2025 Global Crypto Adoption Index through its annual index. The report also said Asia-Pacific on-chain value received grew 69% in the 12 months ending June 2025.
Those figures do not mean every new user buys at the same time. They do suggest a broader base of activity. A larger user base can support more liquidity.
It can also move fear and optimism across borders faster. Strategic planners should think of crypto as a global market with local motives. Remittances and payments may drive one region. Speculation may drive another.
Leverage can turn a fall into a break
Leverage means borrowing or using derivatives to increase exposure. It can make gains look larger. It can also force selling when prices move the wrong way.
Reuters reported that more than $19 billion in leveraged crypto positions were liquidated during a sharp October 2025 drop through its market report. Panic selling and low liquidity added to the move.
This is where cycles become mechanical. A falling price can trigger forced exits. Those exits can push prices lower. More positions then break.
A careful investor watches leverage indicators before assuming a drop reflects only news. A business should also remember that weekend trading can expose thin order books.
Macro policy still counts
Crypto often presents itself as separate from traditional finance. Research suggests a closer link. The IMF paper found that US monetary tightening reduces the crypto factor through a risk-taking channel. In basic terms, tighter money can reduce appetite for assets that move hard.
That link matters for professionals who plan around innovation. A new blockchain product may have strong technology. Funding and user demand can still weaken during a downturn.
Investing resembles writing a project budget in that sense. Instead of judging the plan only by ambition, you check the cash and the timing.
Stablecoins form the waiting room
Stablecoins can influence cycles because they let traders hold dollar-like value inside crypto rails. The IMF’s 2025 Crypto Assets Monitor said USDT and USDC trading volume reached $18.7 trillion in 2025. It also said stablecoins remained a key tool for buying crypto assets or holding on-chain liquidity.
That liquidity can return quickly when confidence improves. It can also leave fast during stress. Stablecoins do not remove volatility.
They make movement easier. For analysts, stablecoin flows can show whether traders are waiting inside the system or heading for the exits.