The Quantumrun Foresight Platform helps businesses thrive from emerging trends by providing tools to discover, organize, and visualize insights that will accelerate strategy development, scenario planning, and product ideation initiatives.
One of the key ways the platform provides this value is by allowing premium users to bookmark trend articles into Lists that they can then convert into Projects that visualize the insights from the bookmarked trend articles in ways that can help organizations make better business decisions.
One of the different project types that your organization can find value from is the VUCA graph.
The VUCA project interface is designed to help organizations integrate trend research into an established management framework used to characterize and assess the ever-changing, unpredictable world that we live and work in.

VUCA methodology
The VUCA project interface is designed to help identify the various uncertainties that organizations must strategize around. To better understand the theory and methodology behind traditional VUCA graphs and how the VUCA project interface can build upon this methodology, please click here.
Getting started
The following usage overview assumes that your team is familiar with the various features of the standard VUCA project interface, as described in this overview.
Step 1: Create a project
The first step when using the VUCA is simply to create one. You can start a project from scratch, as explained here. Or you can start a project based on content curated in one of your lists, as explained here.
Step 2: Fill the project with content
Once your project page is created, it is important to fill your project page with trend content or other forms of data. This content will appear on the left sidebar of the project page and will be used by the platform to populate the graph visualization on the right portion of the project page.
Again, you can accelerate this process by creating a project that references a previously created list populated with curated trend content (read list-to-project tutorial). However, there are many scenarios where an organization may instead want to populate this project exclusively with articles, reports, and links that are internal to the organization (i.e. not available to other platform users).
In the latter scenario, organizations can publish their own content using the ADD A LINK and ADD AN ARTICLE buttons found in the top of the left sidebar. Both of these buttons will open a popup authoring form that will allow you to publish text notes/articles and URLs into the project. (Note that any content added to these projects will only exist inside these projects.) Read details here.
Step 3: Scoring content
From this point, an important element to understand is how are the trend posts distributed on the graph.
Very simply, every human-written article and human-curated Signal link published on the Quantumrun Foresight Platform is scored by Quantumrun foresight professionals using three scoring variables:
- Year/Time: What year the forecast or trend will begin affecting industry, or the world.
- Likelihood: The likelihood that the forecast or trend will become a reality.
- Impact: The impact this trend/innovation might have on industry or the world.
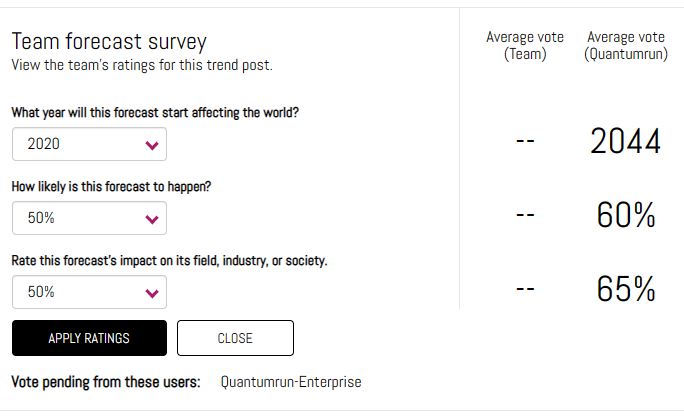
However, in the VUCA graph, you will see a fourth dropdown where you can select one of the four VUCA variables.
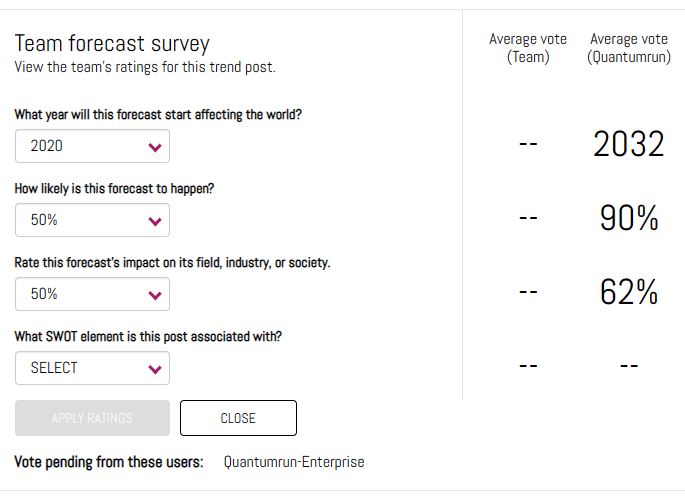
For each trend report and link you score, the selection you make in the fourth dropdown will determine in which of the four VUCA quadrants the report or link will appear.
Meanwhile, the scores cast in the Likelihood and Impact dropdowns will determine the position of these trend reports and links inside these VUCA quadrants. (The scores cast in the Year dropdown are ignored in this project type, but will be utilized in the event that you convert this VUCA graph to another project type—an option available in the Settings popup.)
Step 4: Assessing scoring averages
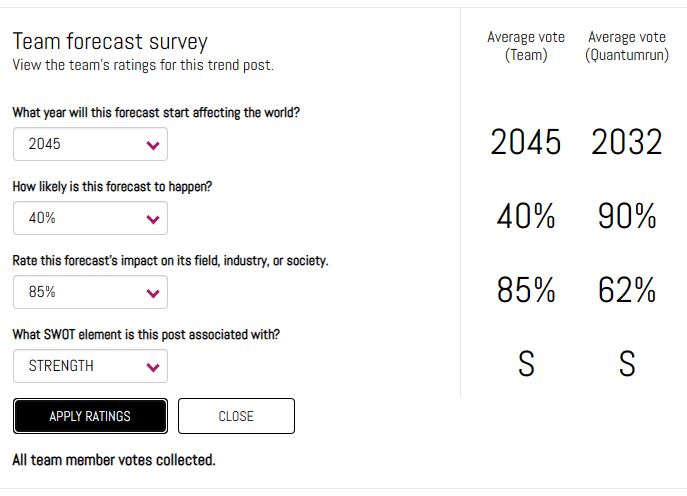
Each team member will be able to view the team’s averaged score after they press the ‘apply ratings’ button.
The second column will display the averaged score collected from members of the Quantumrun Foresight team, but only on those posts created by Quantumrun.
Many organizations find this scoring interface useful because it allows them to conduct anonymous team scoring on various topics.
It also allows individual organizations to see the difference in perspective in how a trend is scored by foresight professionals, for the general market, compared to how an organization’s team scored that same research in a way that is specific to the organization.
Finally, below the ‘apply ratings’ button, will be a list of team members whose scoring is still pending.
Important note: After each team member applies their scoring, the average score will change, meaning that the trend post being scored on will appear to change position on the graph after each person adds their scoring. However, each post will settle on a final position after all team members contribute their scoring.
Step 5: Compare scoring with Quantumrun
The selection you make in the fourth dropdown will determine in which of the four VUCA quadrants the report or link will appear. However, the position of these trend reports and links inside these VUCA quadrants can vary depending on whether the “Quantumrun scoring” toggle in the left sidebar is set to “on” or “off.”
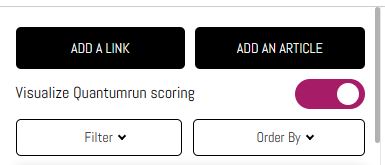
When this toggle is turned on, the position of the trend reports and links will be determined by the average Likelihood and Impact scores cast by the Quantumrun Foresight team.
When this toggle is turned off, the position of the trend reports and links will be determined by the average Likelihood and Impact scores cast by your team.
Step 6: Filtering
Optional: The ‘filter’ popup on the left sidebar will allow you to filter the content visible in the graph. The interactive buttons at the top of the graph will allow you to zoom in and out of the visualization in a variety of ways. Likewise, the ‘SELECT QUADRANT’ button will let you update the visualization (zoom in) from a four-quadrant graph to a single-quadrant graph of your choosing.
Step 7: Interpretation
At this stage, how your team interprets the results of this visualization will be unique to how your organization interprets the project’s insights and data. It will also be influenced by who leads/facilitates the meetings or workshops around this platform.
Overall, the platform facilitates the discovery and curation of trend insights, and the VUCA project interface, in particular, is designed to help assess the complex environmental landscape an organization operates in and to develop a strategic plan to thrive within it.
In other words, the platform will help your team discover what trends are around the corner, and the VUCA graph will help your team discover how your company stands in relation to these trends.
Schedule a free consultation with a Quantumrun Foresight representative to improve your use of the VUCA project interface. Click here.